
Do You Know Your Numbers?
10 KPIs Every Architecture Firm Should Track
Architects and engineers are trained to manage complexity. We coordinate consultants, balance competing priorities, solve technical problems, and guide projects from an initial idea through construction.
Yet many design firm leaders are asked to manage the financial health of their firms without being given a clear understanding of the numbers that matter most.
Financial reports can feel overwhelming, especially when they contain dozens of metrics, accounting terms, and spreadsheets that seem disconnected from the daily work of serving clients and delivering projects.
The good news is that you do not need to become an accountant to better understand your firm. You simply need to consistently track a small group of key performance indicators—or KPIs—that reveal how the business is performing.
Here are 10 KPIs every architecture and engineering firm should understand.
1. Net Revenue
Net revenue is the revenue your firm keeps after subtracting pass-through expenses such as consultants, reimbursable expenses, and other direct project costs.
This is often more useful than total revenue because it represents the money available to pay your employees, cover overhead, and generate profit.
2. Utilization Rate
Utilization measures the percentage of an employee’s available working hours that are charged to billable projects.
A healthy utilization rate helps ensure that your team’s time is aligned with the revenue required to operate the firm. However, the right target will vary by position. Project staff will typically have higher utilization goals than principals or administrative employees.
3. Net Labor Multiplier
The net labor multiplier compares the net revenue generated by your firm to the direct labor cost required to produce that revenue.
In simple terms, it answers the question: For every dollar of direct labor we invest in projects, how much revenue are we generating?
This metric helps leaders evaluate pricing, productivity, staffing, and overall financial performance.
4. Overhead Rate
Your overhead rate represents the cost of operating the business beyond direct project labor.
Overhead includes expenses such as rent, software, insurance, marketing, administration, professional development, and nonbillable staff time.
Understanding your overhead rate is essential because your billing rates and project fees must cover both direct labor and the cost of keeping the firm running.
5. Operating Profit Margin
Operating profit margin shows how much profit remains after the firm pays its operating expenses.
A firm may be busy, growing, and generating significant revenue while still producing very little profit. Tracking profit margin helps leadership determine whether the firm’s workload is actually creating financial strength.
Profit is not the enemy of design excellence. Profit allows a firm to invest in people, technology, training, benefits, innovation, and long-term stability.
6. Project Profitability
Firmwide profit begins with profitable projects.
Project profitability compares the fee earned on a project to the labor and expenses required to deliver it. Monitoring this KPI allows project managers and principals to identify scope creep, fee pressure, staffing inefficiencies, and budget problems before they become unrecoverable.
A project should not be considered successful simply because it was completed. It must also meet the firm’s financial expectations.
7. Backlog
Backlog is the value of contracted work that has not yet been completed or billed.
It provides a forward-looking view of the firm’s workload and revenue potential. Strong backlog can provide confidence when making hiring and investment decisions, while declining backlog may indicate the need for increased business development activity.
Backlog becomes even more useful when it is converted into the number of months of work available for the current team.
8. Accounts Receivable Days
Winning work and completing projects are not enough. Your firm must also collect the money it has earned.
Accounts receivable days—often called days sales outstanding—measures how long it takes clients to pay invoices. The longer invoices remain unpaid, the more pressure is placed on the firm’s cash flow.
Consistent invoicing, clear payment terms, and regular follow-up can significantly improve this metric.
9. Proposal Win Rate
Proposal win rate measures the percentage of pursued opportunities that become contracted projects.
This KPI can help your firm evaluate the quality of its opportunities, the strength of its client relationships, and the effectiveness of its proposals and interviews.
A low win rate may indicate that the firm is pursuing too many poorly aligned opportunities. A thoughtful go/no-go process can help improve both win rate and the return on your marketing investment.
10. Revenue per Employee
Revenue per employee compares the firm’s annual net revenue to the number of full-time employees.
This provides a simple measure of overall productivity and can help leadership evaluate staffing levels, operational efficiency, and growth.
It should not be used to judge individual employees. Instead, it provides a firmwide perspective on whether your staffing and revenue are growing in a sustainable relationship.
Start with Clarity, Not Complexity
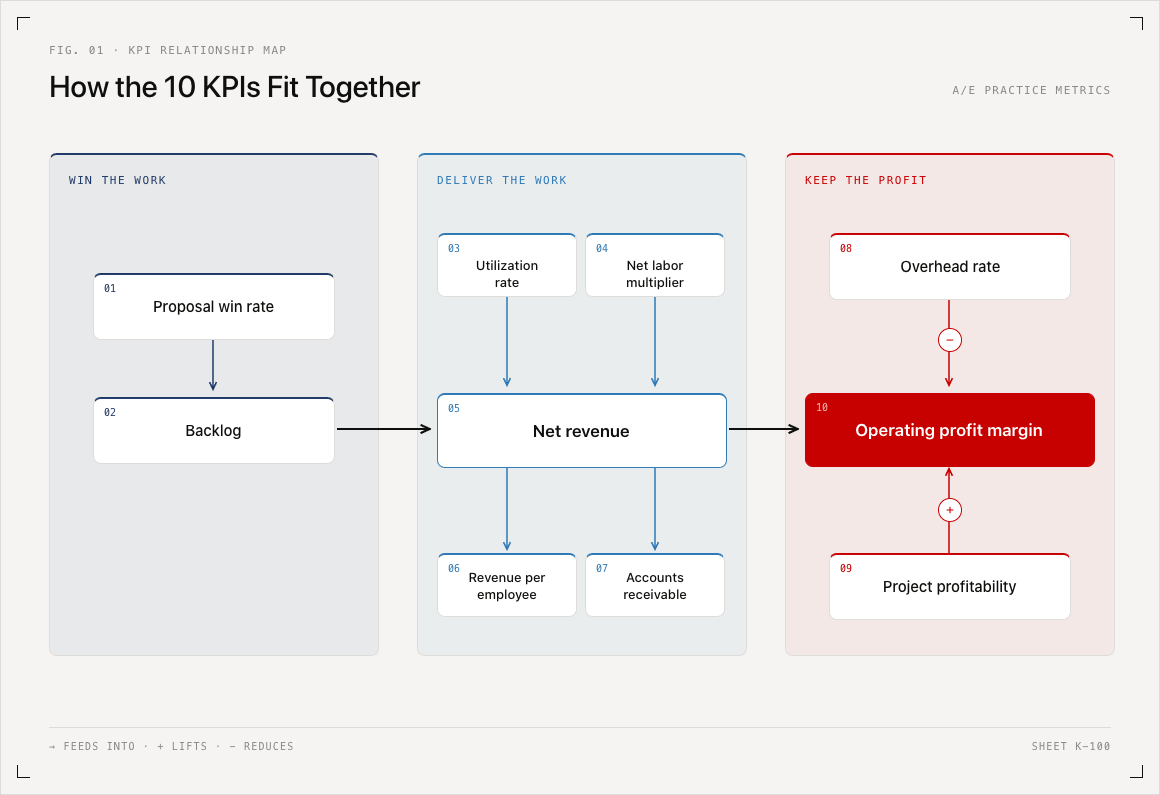
These KPIs are connected.
Utilization and labor multiplier influence revenue. Revenue must cover overhead. Strong project performance supports profitability. Backlog creates future stability, while timely collections protect cash flow.
When firm leaders view these numbers together, they begin to see the story behind the financial statements.
The goal is not to track every possible metric. The goal is to create a consistent management rhythm in which leadership reviews the right information, asks better questions, and takes action before small issues become significant problems.
The AOS Firm KPI Dashboard was created to make that process easier. It organizes the most important architecture and engineering firm metrics into one clear management tool, helping leaders calculate results, monitor trends, establish targets, and communicate performance with their leadership teams.
You do not need another complicated financial report.
You need a dashboard that helps you understand what is happening, why it matters, and where your firm needs to focus next.
Purchase the AOS Firm KPI Dashboard and begin building a clearer, more confident approach to managing your firm’s performance.