
 Image 1 of 1
Successful project managers don't wait until the end of a project to discover they've exceeded the budget.
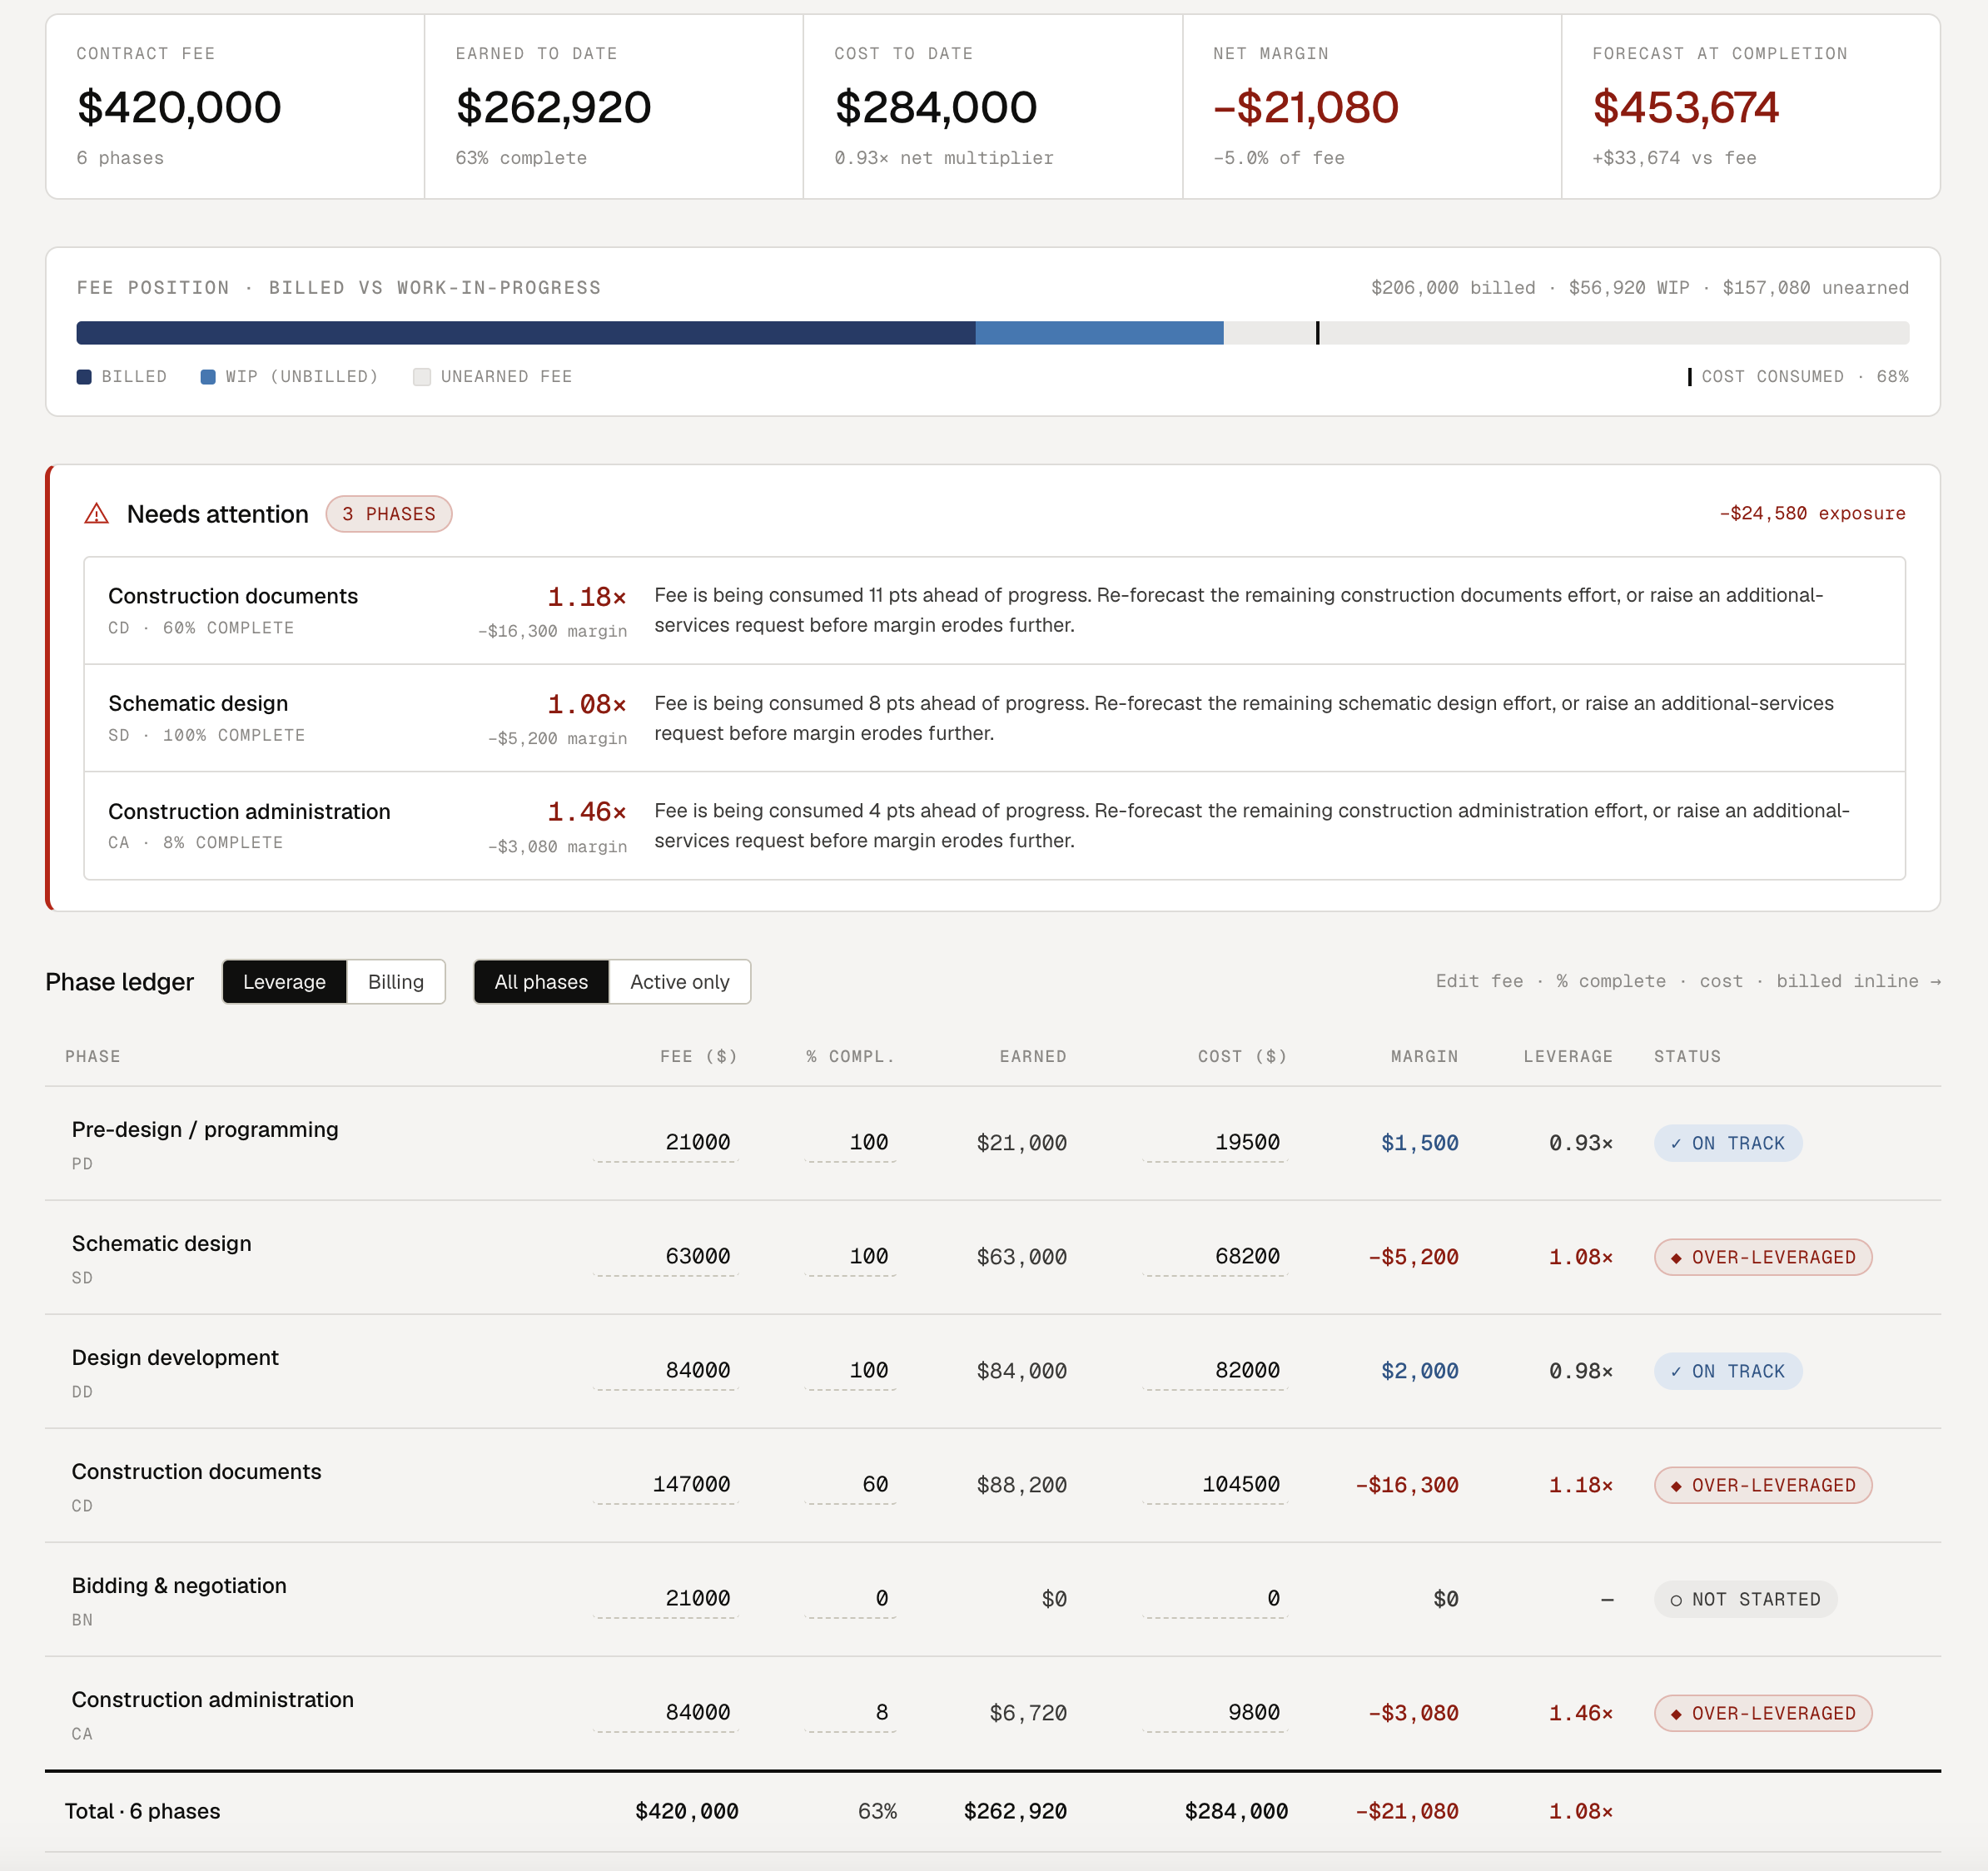
The AOS Project Financial Health Dashboard gives architecture and engineering professionals a clear, real-time view of project performance, empowering them to identify financial risks early, make informed decisions, and keep projects on track before small issues become costly problems.
Designed specifically for design firms, this interactive dashboard transforms complex project financial data into meaningful insights that are easy to understand and act upon. Whether you're reviewing one project or managing an entire portfolio, you'll have the visibility needed to confidently lead projects from kickoff through closeout.
Built from the practical experience of managing profitable design projects, this dashboard helps project managers shift from simply tracking hours to actively managing financial performance.
Monitor Key Project Metrics Including:
Fee Earned vs. Fee Remaining
Labor Budget vs. Labor Spent
Percent Complete
Budget Burn Rate
Remaining Labor Hours
Projected Cost at Completion
Estimated Profit Margin
Labor Utilization by Phase
Consultant Budget Tracking
Additional Services Tracking
Accounts Receivable
Work-in-Progress
Schedule Status
Change Order Log
Included in the Toolkit:
Interactive Project Financial Dashboard (Microsoft Excel)
Project Budget Tracking Worksheet
Fee Burn Analysis Dashboard
Labor Hour Forecasting Tool
Phase-by-Phase Budget Worksheet
Monthly Project Review Template
Project Health Scorecard
Financial Definitions Guide
Setup and Implementation Instructions
Who It's For:
Project Managers
Project Architects
Project Engineers
Studio Leaders
Firm Principals
Operations Managers
Benefits:
Detect budget overruns before they impact profitability
Forecast project financial performance with greater confidence
Improve fee management throughout every project phase
Support more productive monthly project review meetings
Increase accountability across project teams
Improve communication with firm leadership
Deliver projects that are both successful and profitable
Why AOS?
Managing projects isn't just about meeting deadlines—it's about delivering exceptional work while protecting your firm's financial performance.
The AOS Project Financial Health Dashboard provides project managers with the same financial visibility that firm leaders rely on to make strategic decisions. By bringing key project metrics together in one intuitive dashboard, you'll spend less time searching for data and more time leading your team with confidence.
Whether your firm manages ten projects or hundreds, this dashboard provides a repeatable system for measuring financial health, identifying trends, and taking corrective action before profitability is at risk.
Because the best project managers don't just deliver great projects—they deliver profitable ones.
Successful project managers don't wait until the end of a project to discover they've exceeded the budget.
The AOS Project Financial Health Dashboard gives architecture and engineering professionals a clear, real-time view of project performance, empowering them to identify financial risks early, make informed decisions, and keep projects on track before small issues become costly problems.
Designed specifically for design firms, this interactive dashboard transforms complex project financial data into meaningful insights that are easy to understand and act upon. Whether you're reviewing one project or managing an entire portfolio, you'll have the visibility needed to confidently lead projects from kickoff through closeout.
Built from the practical experience of managing profitable design projects, this dashboard helps project managers shift from simply tracking hours to actively managing financial performance.
Monitor Key Project Metrics Including:
Fee Earned vs. Fee Remaining
Labor Budget vs. Labor Spent
Percent Complete
Budget Burn Rate
Remaining Labor Hours
Projected Cost at Completion
Estimated Profit Margin
Labor Utilization by Phase
Consultant Budget Tracking
Additional Services Tracking
Accounts Receivable
Work-in-Progress
Schedule Status
Change Order Log
Included in the Toolkit:
Interactive Project Financial Dashboard (Microsoft Excel)
Project Budget Tracking Worksheet
Fee Burn Analysis Dashboard
Labor Hour Forecasting Tool
Phase-by-Phase Budget Worksheet
Monthly Project Review Template
Project Health Scorecard
Financial Definitions Guide
Setup and Implementation Instructions
Who It's For:
Project Managers
Project Architects
Project Engineers
Studio Leaders
Firm Principals
Operations Managers
Benefits:
Detect budget overruns before they impact profitability
Forecast project financial performance with greater confidence
Improve fee management throughout every project phase
Support more productive monthly project review meetings
Increase accountability across project teams
Improve communication with firm leadership
Deliver projects that are both successful and profitable
Why AOS?
Managing projects isn't just about meeting deadlines—it's about delivering exceptional work while protecting your firm's financial performance.
The AOS Project Financial Health Dashboard provides project managers with the same financial visibility that firm leaders rely on to make strategic decisions. By bringing key project metrics together in one intuitive dashboard, you'll spend less time searching for data and more time leading your team with confidence.
Whether your firm manages ten projects or hundreds, this dashboard provides a repeatable system for measuring financial health, identifying trends, and taking corrective action before profitability is at risk.
Because the best project managers don't just deliver great projects—they deliver profitable ones.